Skip to content

TechConsults

Statistics application-Concrete Normal Distribution Curve

Statistics is a mathematical body of science that pertains to the collection, analysis, interpretation or explanation, and presentation of data. The purpose is to get meaning full information

Statistics applications

Introduction- This topic shall provide brief details for understanding of the statistical terms that are used in engineering application with a reference to concrete test results and their analysis for acceptance of results. The application of statistics shall be discussed in next blog. Terms described in this blog are:

Data

Probability

Mean-Mode-Median

Normal Distribution

Standard Deviation

Z score

Z score calculation

Standard deviation calculation


Statistics in EngineeringThe Standard Deviation (σ)

What is happening in any field can be observed. What is observed can be recorded. Whatever can be recorded is called collection of facts or the DATA

(such as in the form of   numbers, words, measurements, observations or descriptions)

The data is analyzed to get meaningful information.

 Data Type


Survey of whole population is called Census

Survey of a group od Population is called Sample
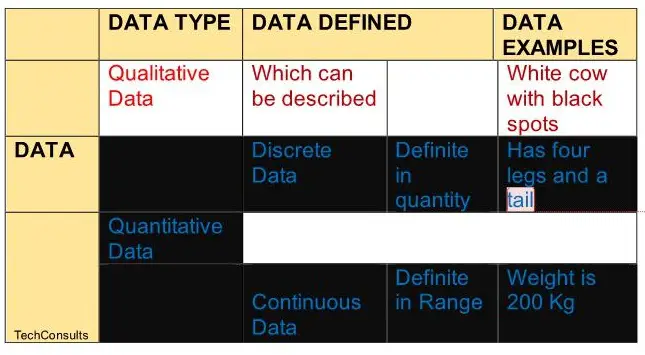
 

Data Types

Analog data –     A sound note changing uniformly and is continuous such without jerks

Digital data A sound note changing uniformly and is continuous such with jerks

Binary data – Used in computers and phones

A Binary Number is made up of only 0s and 1s.

100110 is a binary data- uses only two digits

Bit- Measure of one digit of binary data. The number above has 6 digits

Byte, Megabytes, Gigabytes, Terabytes – are the units of binary data measurement.

 Data is processed, analysed to get information. The information is used in ‘Monitoring & Control’ processes, which is an important group of ‘Project Management Processes’. The data can be represented diagrammatically as

Bar Charts, Pie Charts, Line Graphs, Scatter diagram, Histograms, Frequency Distribution etcetera

 Probability- Probability is a branch of mathematics that deals with occurrence of a random event. For example,

When a coin is tossed in the air, the possible outcomes are Head and Tail. Hence probability of either head or tail is1/2.


When a dice having six faces numbering 1, 2, 3, 4, 5, 6, is thrown there I probability that any number from 1 to 6 can come on top. Hence probability of any number coming on top is 1/6


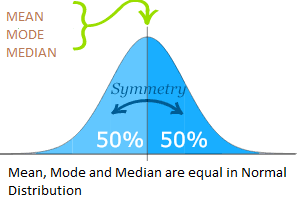
Mean, Median and Mode are the measures of central value of a data set.

Mean

The mean of data set 14,18,12,17,12,13,11,10, 9, 8= sum of all numbers/number of data

(14+18+12+17+12+13+11+10+9+8) / 10 = 12.4 is the mean


Mode is the value that occurs most time

 Median of data 6,8, 9, 10, 11, 12, 12, 14, 14, 17, 18

Arrange the data in a sequence. The central figure 12 is the median value. If centre dataset has even numbers, then find the average of two central values to get the Median value.

 If an event is random, it means that it does not seem to follow a definite plan or pattern or outcome.

Data observed can be found to have distribution towards left or towards right or towards centre or skewed.

The date which is centrally distributed is called normal distribution. Many things closely follow a Normal Distribution which includes outputs of engineering, studies, and research.

As an example, the crushing strength of same type of concrete cubes, is recorded as data  for  strength of concrete analysis, say 30 cubes (N=30).

Let the strength of concrete grade for which cubes are tested be 30 MPa.

The test strength of 30MPa concrete may not be 30 all the time, but it shall vary. This variation say is from 25 MPa to 35 MPa.

The test strength of each of 30 samples is recorded. Then the data is tabulated for strength and frequency. The strengths shall have frequency. (If 28 MPa test strength is observed 5 times in th 28 MPa is 5)

The strengths of the concrete when plotted against the frequency shall show a normal distribution. It shows that the strength of cubes has a mean value, and some of test results are close tohirty test operations, it means the frequency of strengt mean value on left and right side.

 We say the data is “normally distributed”. The shape of the curve is as shown below: (source Wikipedia)

X-axis   Strength (MPa)

y-axis   Frequency

 The main features of the ND curve are:

Abscissa, x-axis, represents the compressive strength, y-axis, represents the frequency of occurrence.

Total area of curve is equal to unity

Mean is a point on the x-axis having maximum frequency and dividing the area into two exact halves. The curve is symmetrical about mean.


Dark blue is less than one standard deviation from the mean. For the normal distribution, this includes 68.27 percent of the numbers.

Medium blue and Dark blue is two standard deviations from the mean include 95.45 percent.

 Light blue, Medium blue, and Dark blue is 3 standard deviation and include 99.73 %. The other area accounts for 4 σ,5 σ and 6 σ.

The Normal Distribution has:

  • mean = median = mode

  •  Data distribution is symmetry about the canter

  • 50% of values less than the mean and 50% greater than the mean


The normal distribution is mathematically defined completely by two statistical parameters: 

Population mean- μ and

Standard deviation- σ.


A mathematical characteristic of the normal distribution is that

(A)- 68.27% of the data lies within 1 standard deviation from the mean

(B)- 95.45% of the data is within 2 standard deviations.

(C)- 99.70% of the data is within 3 standard deviations

Standard deviation is a number used to tell how measurements for a group are spread out from the average (mean) value.

A low standard deviation means that most of the numbers are close to the average.

A high standard deviation means that the numbers are more spread out and therefore the results are not consistent, and the design need to be reviewed’

A ‘Standard Normal Distribution’ is a normal distribution with mean (μ )  and standard deviation (σ) 1,2, 3…..

  • Areas under this curve can be found using a ‘standard normal table’

  • The 68% of the observations fall between -1 σ and 1 σ

  • The 95% fall between -2 σ and 2 σ

  • The 99.7% fall between -3 σ and 3 σ.

 Z Score

 A z-score or standard score, gives an idea of how far from the mean, a data point is. Standard Normal Curve (SNC) has the raw data values on x -axis plotted with frequency on y- axis.  The x-axis has a mean value.  If it is required to find any raw data value distance from mean, in terms of σ, it can be calculated and is called Z Score. Hence it is a measure of how many standard deviations below or above the mean (μ) a raw score is.

A z-score can be placed on an NDC.

Z-scores range from -3 σ standard deviations up to +3 σ standard deviations

The z-score formula is:

z- is the “z-score”

x- is the value to be explored

μ- is the mean

σ- is the standard deviation

Z score calculation

Let us find the z- score for 26 MPa from the example above.

X=26

μ = 30

σ=4

z-score= (x – μ)/σ= (26-30)/4=-1

The z-score is μ-1

This means that cube strength below μ-1 have values < 26 MPa and 99.7/2+34=83.85% test results have value > 26 MPa


Formula for SD

When your data is the whole population the formula is:

(The “Population Standard Deviation”)

When your data is a sample the formula is:

(The “Sample Standard Deviation”)

The important difference is “N-1” instead of “N”

x̅ =mean

x= data value

N=Number of data

Statistics provide necessary help for coming out to a criterion which may be fruitful for use and develop acceptance criteria of concrete test results.

The terms like average, mean, standard deviation, variance, normal distributions of statistics are used to explore these random variables for an outcome.

The outcome test samples (say 30) is tabulated for the strength and its frequency, and this data becomes the data for normal distribution curve – x axis as strength and y axis as frequency.


The analysis of strength test results presented as above  assumes that the test results under consideration are normally distributed


Consider a concrete batch form which concrete is taken to cast say three or four samples. (Each sample having three specimen)

Getting the strength of specimen from heterogeneous concrete is also an event and it is random as this and   other specimens of the same sample provide different results. The outcome is not predictive, therefore the average strength of three specimens is used as the strength of a sample for consideration

General-Blog posts from Tec Consults shall be based on the topics given in the ‘JOIN US’ page, but not limited to available list of topics on the http://techconsults.in. Viewers are now free to join TecConsults and can contact sksaxena@techconsults.in and info@techconsults.in    for their suggestions for managing the main and sub topics.     www.techconsults.in . SK Saxena     TechConsults