

Earned Value Management
SK SAXENA PMP
PV AC EV Curves
PV curve is the planned value curve.
Whenever the project is planned then the curve plotted between the cumulative planned expenditure of the project with respect to time line is called PV (Planned Value) Curve. It is to be ensured that the expenditure done on the project must follow this line values. However, depending upon the project execution period environment there may be variations of actual cost (AC) with respect to PV, but there should be monitoring for such variations, and necessary alignment in PV and AC should be maintained.
If at any time AC value is above or below the PV value, it tells us that the expenses are than the desired values and required controls are exercised accordingly.
In case of larger variations which are not controllable, the PV may be revised with a proper approval.
AC= Actual money spent up to a time.
PV=Planned value up to a time
It is clear now what is PV and AC.
There is another important term which is called Earned Value (EV)
Even after spending (AC) up to planned expenditure (PV), there is no guarantee that the value of work done is in conformity with the AC. (Suppose the value of work is 100 up to a point on time line and the expender done is 100, it does not ensure that the work is 100 percent complete. We must ascertain what percentage of work is done and what is its value. The value of this work done is earned Value (EV))
Therefore, the value of actual work done is determined and it is called Earned Value (EV).
EV= Is the value of actual work done from the money s(AC)
The EV PV and AC data on the timeline can be analyzed to get meaningful information.
EV-PV=Schedule Variance (the relation between PV and EV)
Schedule Variance (SV) = Earned Value (EV) – Planned Value (PV)
If SV is positive, it means that the actual value of work done is more than the planned value and the progress is ahead of schedule.
If SV is negative, it means that the actual value of work done is less than the planned value and the progress is behind schedule.
Cost Variance (CV) = Earned Value (EV) – Actual Cost (AC)
If CV is positive, it means that the actual value of work done is more than the planned value
If CV is negative, it means that the actual value of work done is less than the planned value and the project is over budgeted
Example of Schedule Variance (SV) and Cost variance (CV
In a project with a budgeted cost of $ 100,000, for a period of 18 months, following data was noticed after a period of 10 months:
PV at 10 months= $ 70000
Money spent=$ 75000
Work complete = 40 percent
Find the project’s Schedule Variance and cost variances and the inference from this analysis
Given in the question:
Actual Cost (AC) = $ 75000
Planned Value (PV) = $ 70000
Earned Value (EV) = $40000 (40 % of $100000)
Schedule Variance =Earned Value – Planned Value
= 40,000 – 70000
= – 30,000
Inference: The SV is -30000 and the project is behind the schedule
Cost Variance = Earned Value – Actual Cost
CV = EV – AC
= 40,000 – 75000
= –35000
Inference: The Cost Variance is -35000, and the project is over budgeted
The PV AC and EV curves are shown below:
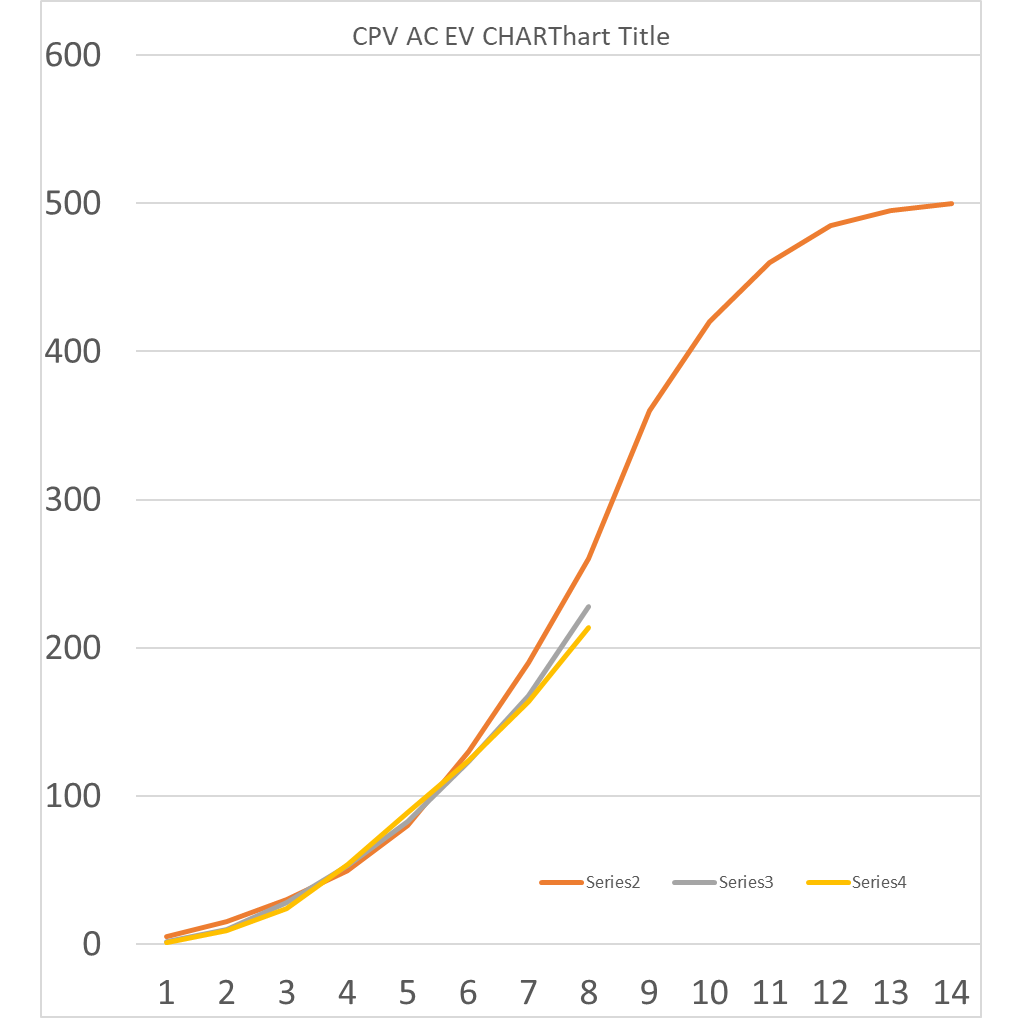
The above curves are based on the following data;
Monthly Expenses | CUMULATIVE VALUES of PV AC EV | Schedule Variance | Cost Varience | |||
S N0. | PV | PV | AC | EV | EV-PV | EV-AC |
1 | 5 | 5 | 2 | 1 | -4 | -1 |
2 | 10 | 15 | 10 | 9 | -6 | -1 |
3 | 15 | 30 | 28 | 24 | -6 | -4 |
4 | 20 | 50 | 53 | 54 | 4 | 1 |
5 | 30 | 80 | 83 | 89 | 9 | 6 |
6 | 50 | 130 | 123 | 124 | -6 | 1 |
7 | 60 | 190 | 168 | 164 | -26 | -4 |
8 | 70 | 260 | 228 | 214 | -46 | -14 |
9 | 100 | 360 | ||||
10 | 60 | 420 | ||||
11 | 40 | 460 | ||||
12 | 25 | 485 | ||||
13 | 10 | 495 | ||||
14 | 5 | 500 | ||||