
TechConsults
Earned Value Management - S Curve
- SK Saxena PMP
- sksaxena@techconsults.in
Project Management- SK 22
S-Curve and project Management
S Curve is used for planning, monitoring, controlling, analyzing, and forecasting project’s status, progress, & performance over time and can be used to find the historical trends in project development
A project when planned, needs money for its execution, along with the requirement for other parameters (Man, Material, Money, Methods, Motivation, Management Etcetera). The project activities / tasks are sequenced as per requirements on time line of the project. The Work Breakdown Structure (WBS) breaks the activities / tasks into small components for different units to work on them, and as such the cost aspects of the works are ascertained (determined in scientific manner / observations).
With the help of WBS and the schedule it is ascertained how much money is required periodically. Mostly in all the project the pace of work starts slowly in the starting phase of the project. After that the speed of execution of project increases and this stage continues for most of the project work to get completed. In the closing stage of the project the pace of work slows down, and the project gets completed after some time.
The requirement of fund is therefore analogous to the pace of work.Let us consider the project period of 12 months. The money required as described above is tabulated as monthly requirement or fund flow requirement or the planned requirement of project work.
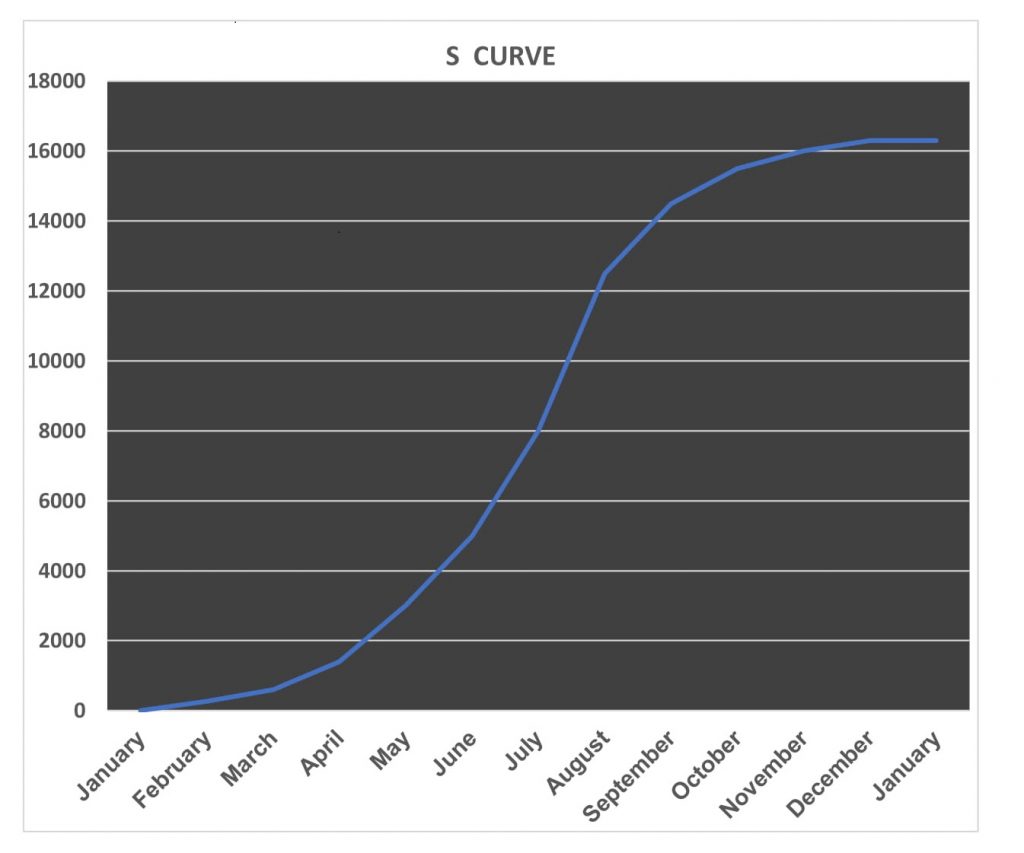
The table below shows the monthly and cumulative fund flow requirement.
Months | Monthly Expenses | Cumulative Expenses |
January | 70 | 0 |
February | 200 | 270 |
March | 400 | 600 |
April | 800 | 1400 |
May | 1600 | 3000 |
June | 2000 | 5000 |
July | 3000 | 8000 |
August | 4500 | 12500 |
September | 2000 | 14500 |
October | 1000 | 15500 |
November | 500 | 16000 |
December | 300 | 16300 |
January | 0 | 16300 |
The graph between the cumulative fund flow and project time line is given below. The curve generated as such is a Sigmoidal Curve (Mathematically) and has a shape resembling the letter ‘S’. Hence is called S-Curve. Its use is also in business and other operations along with life sciences. The curve shown below is a S–Curve